UK Digital Dead Zone 2025: The best and worst-connected cities revealed
Broadband has become as essential as electricity – powering how we work, study, stream and stay in touch. But not every part of the UK is keeping up.
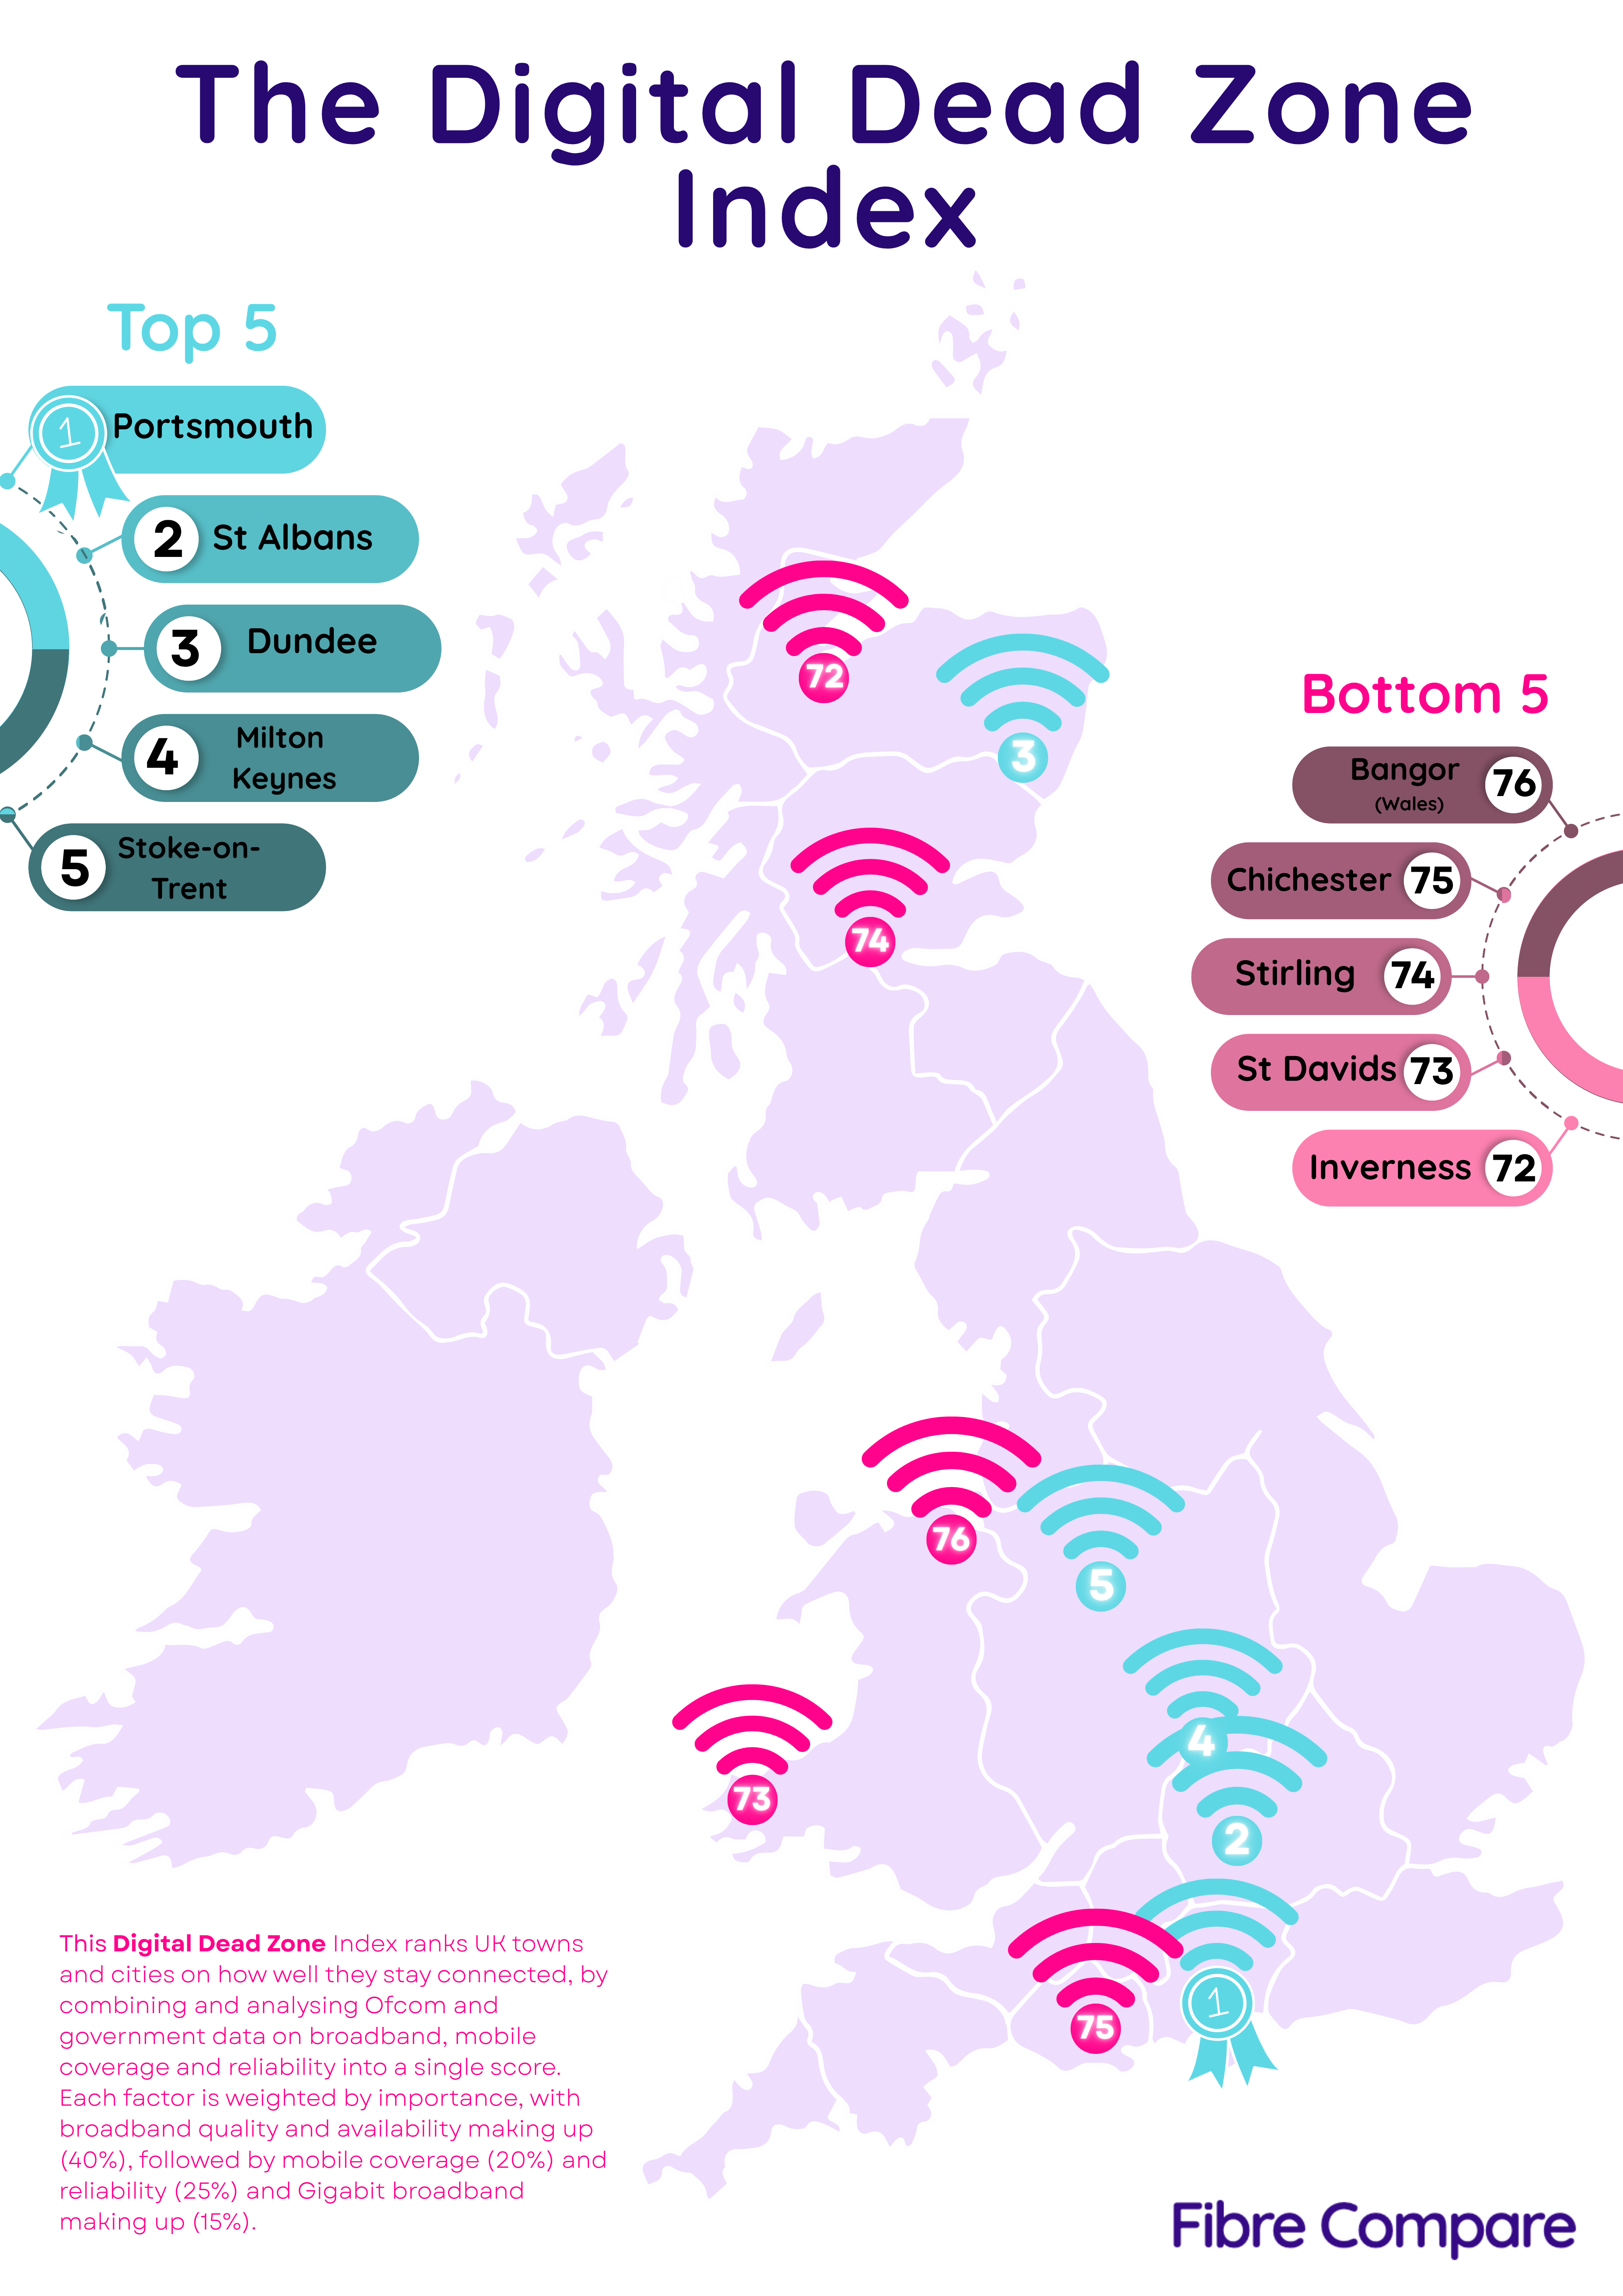
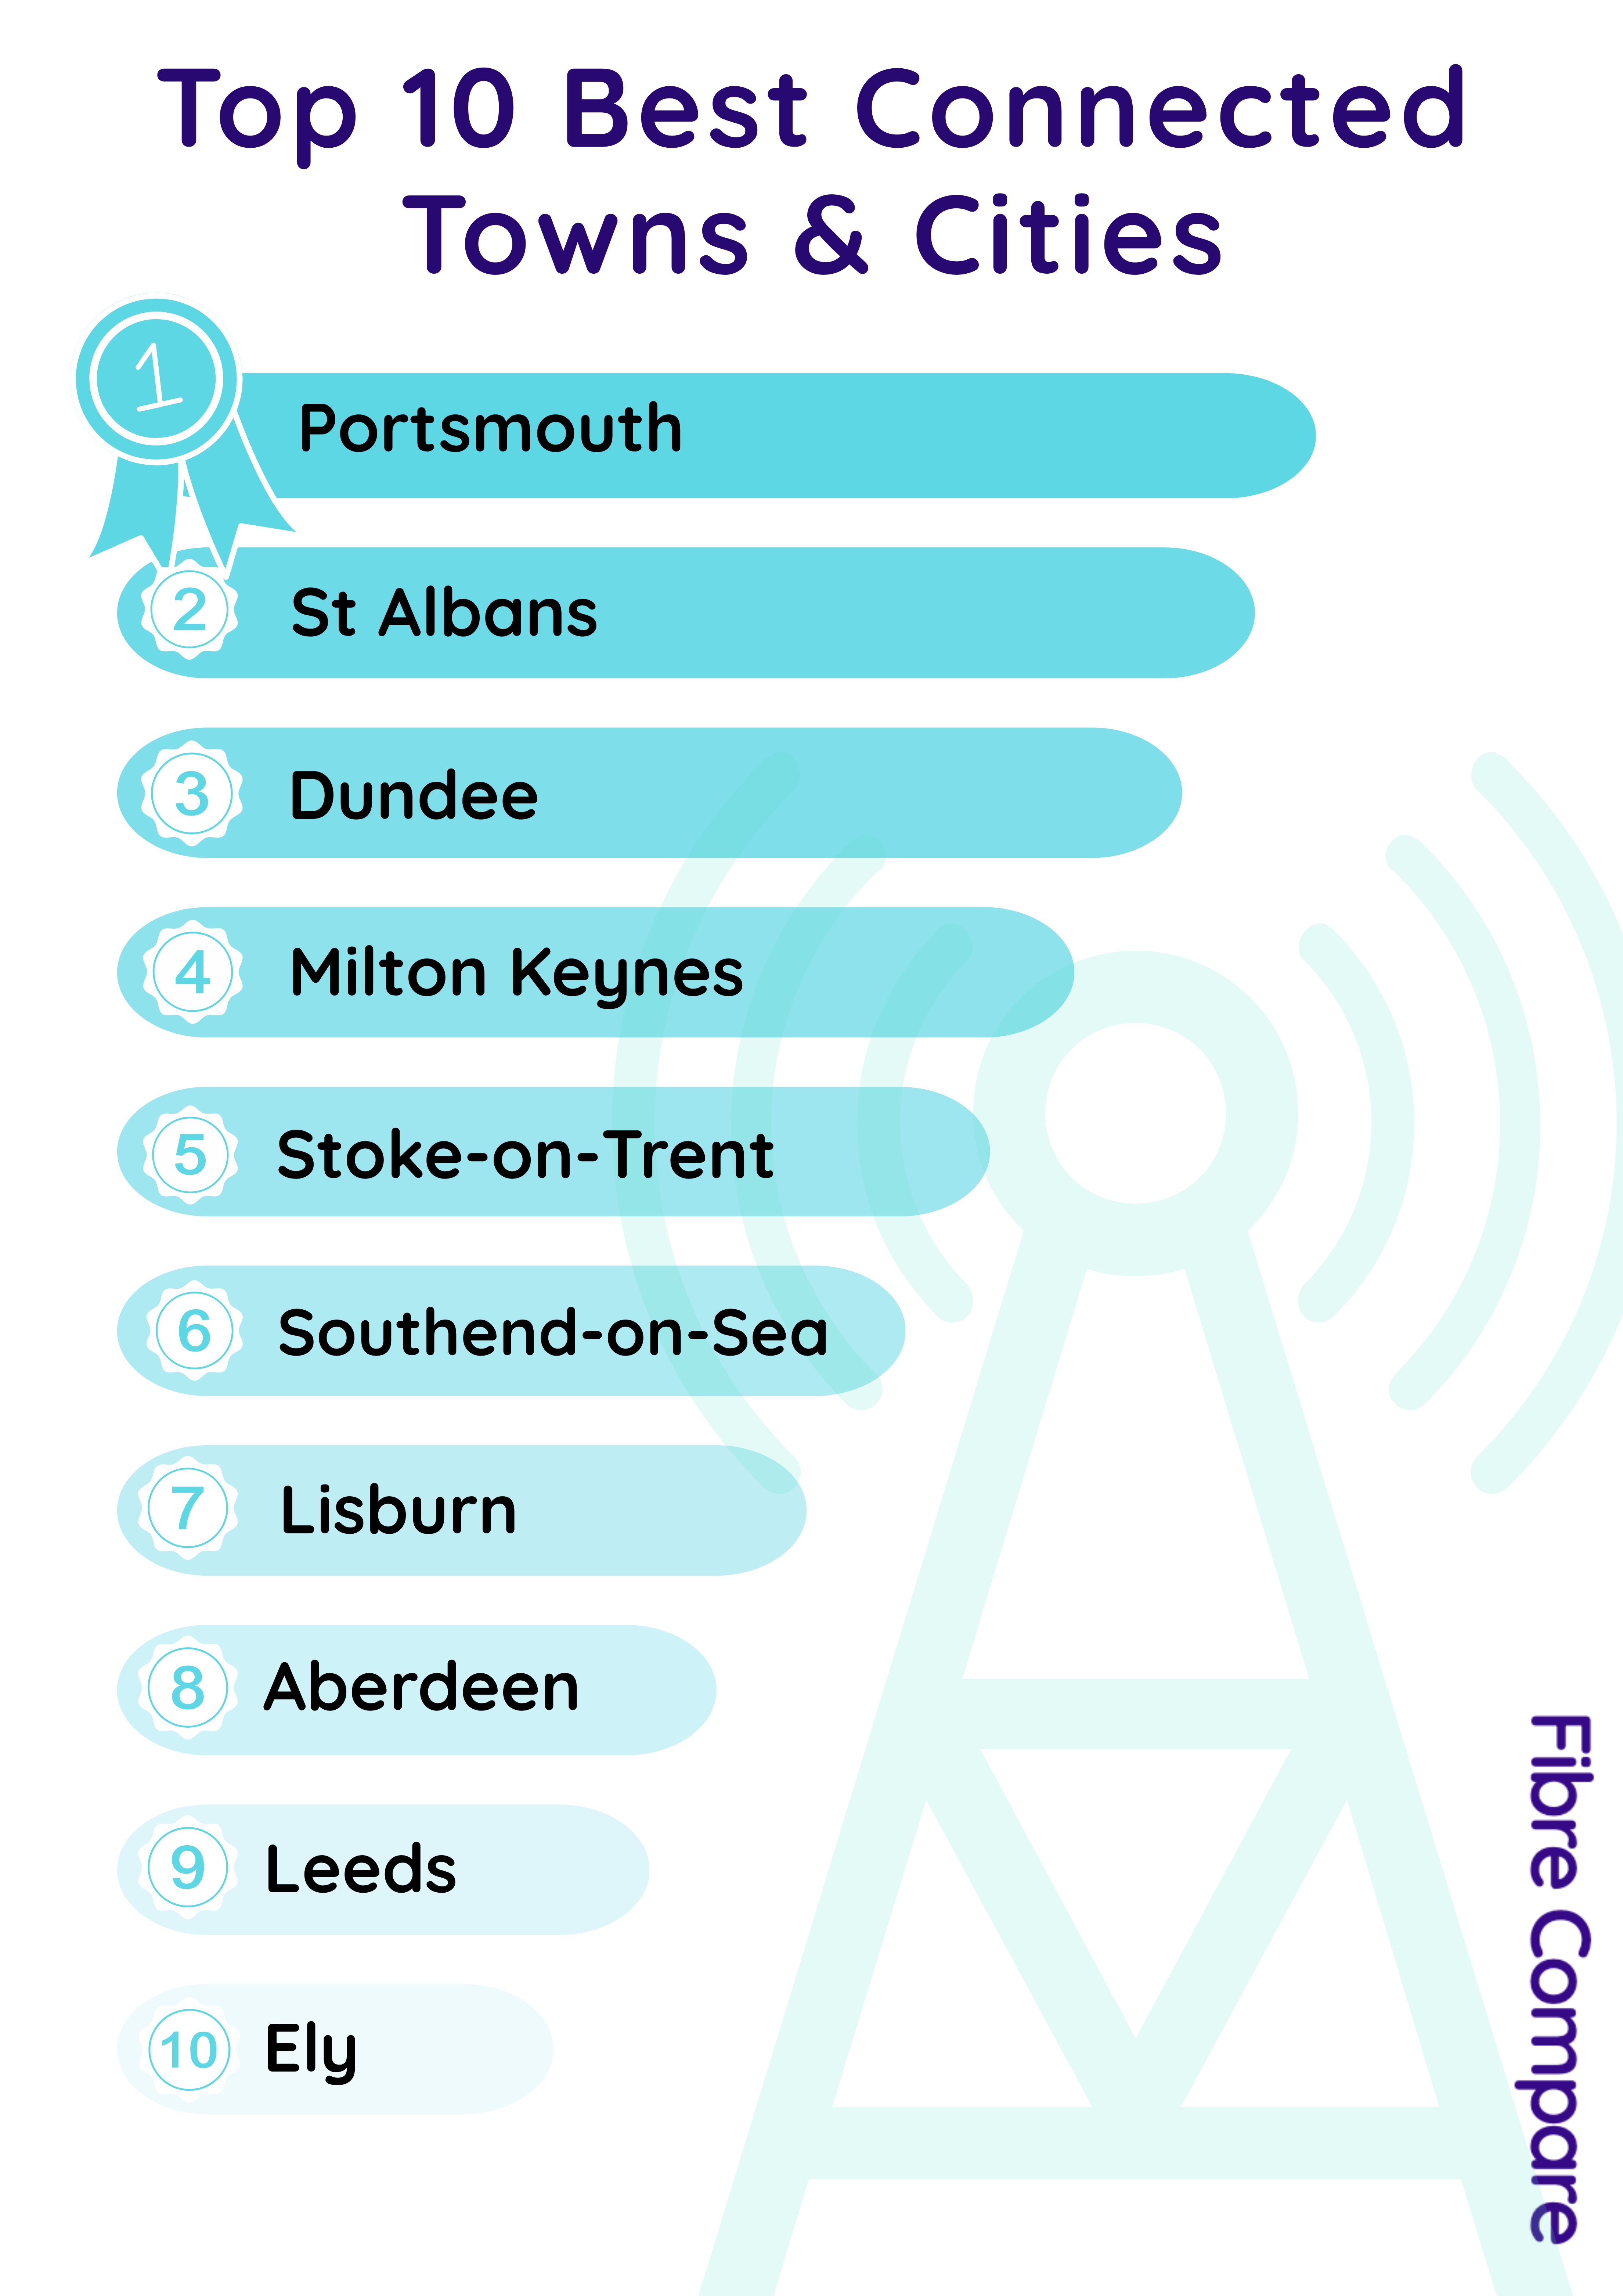
Our brand-new Digital Dead Zone Index reveals where connectivity thrives and where it still falls short. Leading the way are Portsmouth, St Albans, Dundee, Milton Keynes and Stoke-on-Trent – all proving that strong investment and fibre upgrades really do make a difference.
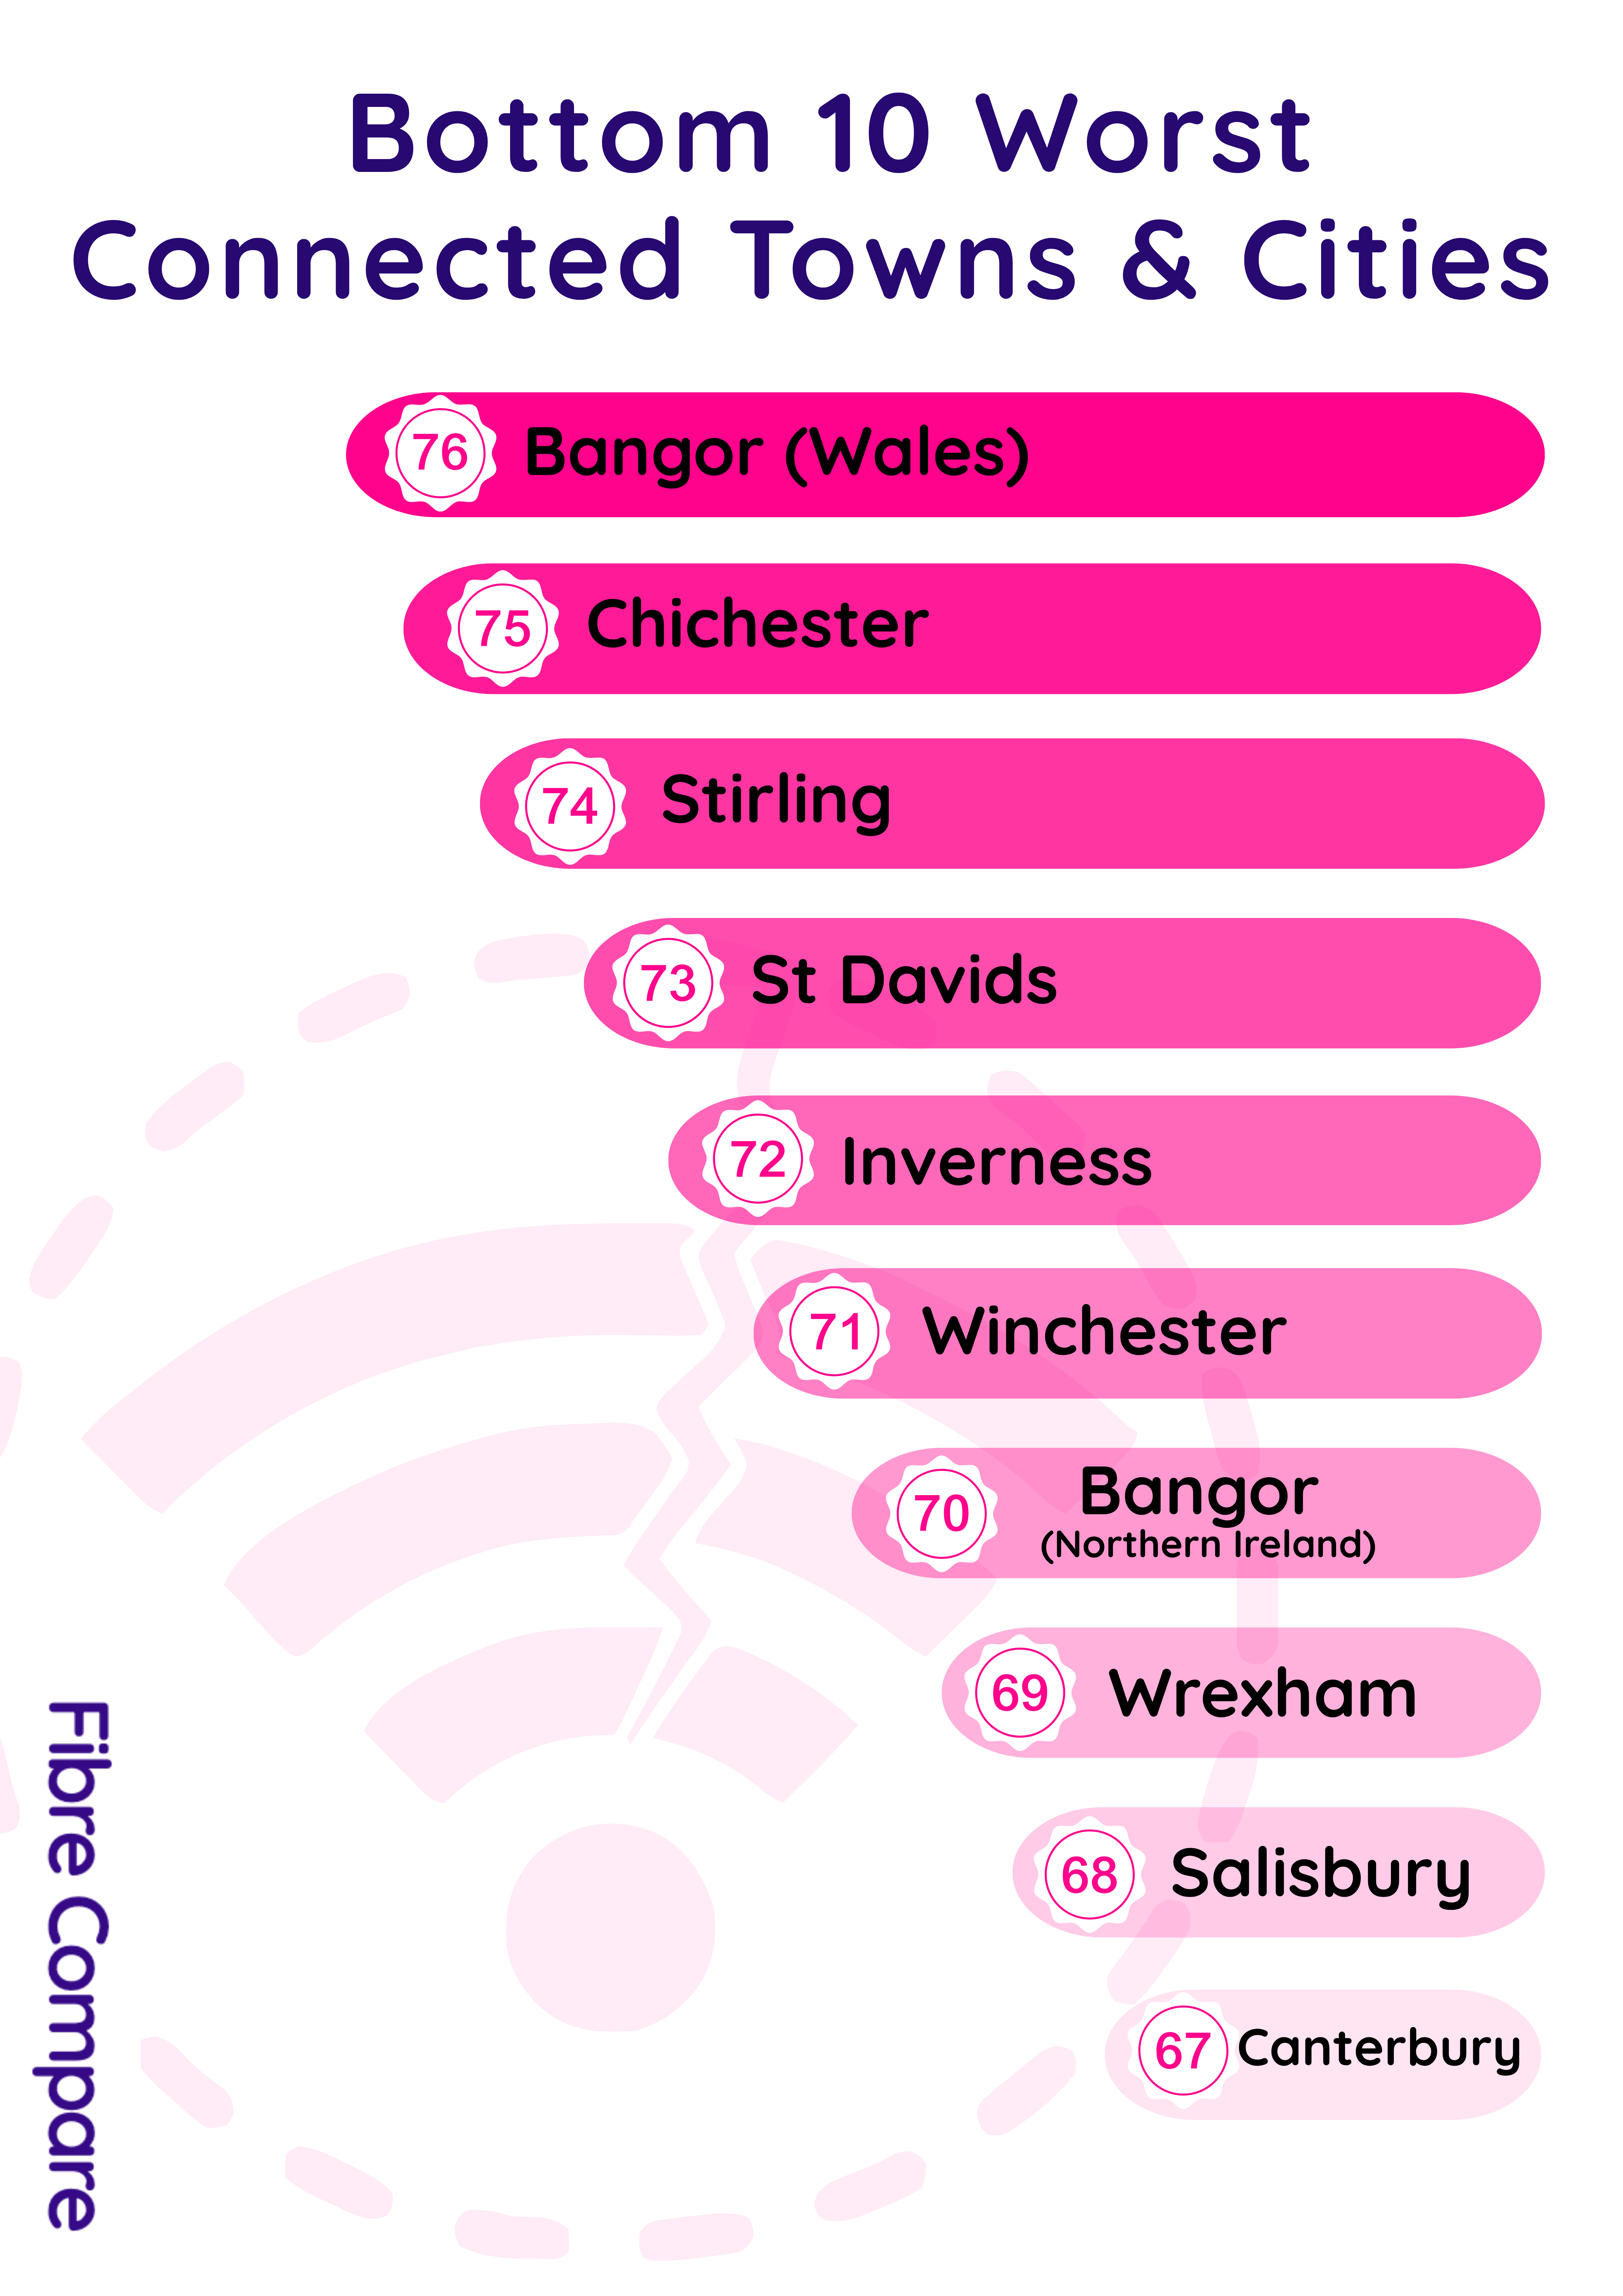
At the bottom? Bangor (Wales), Chichester, Stirling, St Davids and Inverness, where old infrastructure and tricky terrain are still holding residents back.
“We built the Digital Dead Zone Index to show what’s really going on behind the UK’s broadband stats. It reveals where progress is happening and where people are still being left behind,” says Geoff Pestell, CEO of Fibre Compare.
What the index measures
To give a clear, fair picture, the Digital Dead Zone Index pulls together the latest Ofcom and government data on broadband and mobile coverage, blending it into one easy-to-compare score.
Each factor is weighted by importance:
- Broadband quality and availability – 40%
- Reliability and outages – 25%
- Mobile coverage (4G & 5G) – 20%
- Gigabit broadband access – 15%
The result? A simple ranking that shows where it’s easiest (and hardest) to stay connected.
| CITY |
SUPERFAST AVAILABILITY % |
ULTRAFAST 100 AVAILABILITY % |
ULTRAFAST AVAILABILITY % |
GIGABIT AVAILABILITY % |
FULL FIBRE AVAILABILITY % |
Average Download Speed (Mbps) |
Average Upload Speed (Mbps) |
4G Coverage (% of homes / premises) |
5G Coverage (% of homes / premises) |
Estimated % of Users with Frequent Signal Loss |
Estimated Outage Reports (per 1,000 users) |
New Dead Zone Score |
1 = Worst |
| Bangor (Wales) |
93 |
59 |
58 |
57 |
57 |
287 |
38 |
20 |
75 |
10 |
40 |
73 |
1 |
| Chichester |
95 |
65 |
63 |
64 |
64 |
290 |
107 |
20 |
80 |
9 |
39 |
63 |
2 |
| Stirling |
95 |
69 |
68 |
68 |
68 |
283 |
199 |
20 |
80 |
9 |
45 |
62 |
3 |
| St Davids |
95 |
63 |
63 |
63 |
64 |
270 |
41 |
20 |
67 |
8 |
25 |
62 |
4 |
| Inverness |
89 |
62 |
62 |
62 |
62 |
316 |
32 |
20 |
80 |
12 |
12 |
61 |
5 |
| Winchester |
94 |
63 |
64 |
63 |
42 |
304 |
49 |
20 |
80 |
6 |
31 |
61 |
6 |
| Bangor (Northern Ireland) |
93 |
71 |
69 |
68 |
68 |
287 |
38 |
20 |
75 |
10 |
27 |
60 |
7 |
| Wrexham |
97 |
71 |
71 |
70 |
70 |
303 |
36 |
20 |
67 |
8 |
25 |
53 |
8 |
| Salisbury |
97 |
78 |
78 |
78 |
74 |
305 |
42 |
20 |
80 |
7 |
40 |
52 |
9 |
| Canterbury |
94 |
70 |
70 |
70 |
70 |
271 |
54 |
20 |
80 |
10 |
12 |
51 |
10 |
| Bath |
97 |
83 |
80 |
78 |
68 |
303 |
110 |
20 |
80 |
4 |
49 |
51 |
11 |
| Dunfermline |
99 |
83 |
83 |
83 |
82 |
304 |
80 |
33 |
75 |
10 |
45 |
51 |
12 |
| Oxford |
96 |
86 |
82 |
79 |
34 |
315 |
36 |
50 |
75 |
9 |
25 |
49 |
13 |
| Plymouth |
98 |
95 |
95 |
94 |
68 |
312 |
46 |
20 |
80 |
9 |
48 |
49 |
14 |
| Liverpool |
97 |
93 |
92 |
91 |
84 |
309 |
50 |
25 |
50 |
6 |
48 |
49 |
15 |
| Lichfield |
98 |
85 |
85 |
84 |
74 |
307 |
38 |
20 |
80 |
10 |
33 |
49 |
16 |
| Truro |
91 |
60 |
60 |
60 |
60 |
286 |
41 |
20 |
80 |
7 |
14 |
48 |
17 |
| Westminster |
96 |
86 |
88 |
86 |
84 |
288 |
212 |
50 |
0 |
5 |
41 |
48 |
18 |
| Colchester |
98 |
83 |
83 |
83 |
55 |
307 |
82 |
20 |
80 |
6 |
37 |
48 |
19 |
| York |
98 |
92 |
91 |
90 |
84 |
289 |
110 |
20 |
80 |
9 |
43 |
47 |
20 |
| Preston |
99 |
88 |
87 |
87 |
64 |
305 |
66 |
20 |
80 |
7 |
40 |
47 |
21 |
| Newry |
98 |
91 |
91 |
91 |
91 |
307 |
42 |
20 |
80 |
8 |
45 |
46 |
22 |
| Newcastle-upon-Tyne |
99 |
95 |
94 |
94 |
88 |
301 |
75 |
25 |
75 |
8 |
48 |
45 |
23 |
| Durham |
98 |
80 |
79 |
79 |
77 |
304 |
39 |
20 |
80 |
8 |
27 |
45 |
24 |
| Edinburgh |
99 |
94 |
93 |
93 |
81 |
302 |
94 |
20 |
80 |
7 |
47 |
44 |
25 |
| Hereford |
95 |
83 |
82 |
83 |
83 |
297 |
158 |
20 |
80 |
9 |
25 |
43 |
26 |
| Brighton & Hove |
98 |
90 |
87 |
84 |
53 |
310 |
58 |
20 |
80 |
8 |
23 |
43 |
27 |
| Swansea |
99 |
91 |
91 |
90 |
78 |
309 |
36 |
20 |
80 |
7 |
36 |
42 |
28 |
| Bristol |
98 |
95 |
95 |
95 |
80 |
309 |
51 |
20 |
75 |
6 |
41 |
42 |
29 |
| Exeter |
97 |
91 |
91 |
91 |
78 |
308 |
36 |
20 |
75 |
9 |
27 |
41 |
30 |
| Gloucester |
99 |
94 |
94 |
94 |
46 |
310 |
61 |
25 |
75 |
9 |
27 |
41 |
31 |
| Wells |
97 |
82 |
81 |
79 |
73 |
290 |
111 |
20 |
80 |
8 |
18 |
41 |
32 |
| Glasgow |
99 |
95 |
95 |
94 |
90 |
300 |
100 |
20 |
67 |
9 |
36 |
40 |
33 |
| Nottingham |
99 |
97 |
96 |
96 |
73 |
306 |
67 |
33 |
67 |
8 |
36 |
40 |
34 |
| Wakefield |
99 |
96 |
96 |
96 |
94 |
304 |
53 |
20 |
80 |
10 |
37 |
40 |
35 |
| Lincoln |
96 |
91 |
91 |
91 |
84 |
307 |
69 |
33 |
75 |
8 |
32 |
40 |
36 |
| Doncaster |
99 |
93 |
92 |
92 |
88 |
299 |
80 |
20 |
80 |
8 |
37 |
39 |
37 |
| Sunderland |
99 |
94 |
93 |
93 |
64 |
309 |
55 |
25 |
80 |
10 |
25 |
39 |
38 |
| Salford |
98 |
93 |
93 |
92 |
82 |
304 |
79 |
33 |
75 |
7 |
37 |
39 |
39 |
| Coventry |
99 |
97 |
97 |
97 |
96 |
295 |
126 |
20 |
75 |
10 |
36 |
38 |
40 |
| Sheffield |
98 |
94 |
94 |
93 |
90 |
300 |
87 |
20 |
80 |
11 |
25 |
38 |
41 |
| Peterborough |
99 |
95 |
95 |
95 |
93 |
292 |
167 |
20 |
80 |
9 |
39 |
38 |
42 |
| Norwich |
100 |
95 |
94 |
93 |
74 |
307 |
48 |
33 |
75 |
10 |
27 |
38 |
43 |
| Carlisle |
96 |
86 |
86 |
85 |
79 |
284 |
53 |
20 |
80 |
10 |
6 |
38 |
44 |
| Londonderry |
97 |
92 |
92 |
92 |
92 |
297 |
38 |
20 |
80 |
9 |
20 |
37 |
45 |
| Leicester |
100 |
98 |
98 |
98 |
93 |
301 |
93 |
33 |
67 |
9 |
35 |
36 |
46 |
| Chelmsford |
98 |
86 |
85 |
84 |
75 |
302 |
60 |
20 |
80 |
9 |
9 |
35 |
47 |
| Newport |
99 |
92 |
92 |
92 |
81 |
307 |
42 |
20 |
80 |
8 |
21 |
35 |
48 |
| Armagh |
99 |
94 |
94 |
94 |
94 |
286 |
43 |
20 |
80 |
6 |
30 |
35 |
49 |
| London |
94 |
86 |
86 |
86 |
84 |
283 |
221 |
100 |
0 |
9 |
8 |
35 |
50 |
| Manchester |
96 |
91 |
90 |
90 |
83 |
295 |
122 |
33 |
50 |
9 |
10 |
35 |
51 |
| Bradford |
99 |
94 |
93 |
92 |
81 |
290 |
118 |
20 |
80 |
7 |
23 |
34 |
52 |
| Birmingham |
98 |
96 |
95 |
95 |
79 |
309 |
52 |
25 |
80 |
8 |
23 |
34 |
53 |
| Southampton |
99 |
97 |
96 |
95 |
89 |
280 |
154 |
50 |
75 |
6 |
38 |
33 |
54 |
| Cardiff |
99 |
95 |
95 |
94 |
83 |
307 |
47 |
20 |
75 |
8 |
20 |
33 |
55 |
| Belfast |
100 |
97 |
97 |
98 |
94 |
308 |
35 |
20 |
75 |
5 |
34 |
33 |
56 |
| Chester |
97 |
87 |
85 |
84 |
83 |
299 |
53 |
20 |
80 |
6 |
9 |
32 |
57 |
| Kingston-upon-Hull |
100 |
100 |
100 |
100 |
100 |
252 |
99 |
33 |
50 |
7 |
22 |
32 |
58 |
| Cambridge |
99 |
96 |
96 |
95 |
88 |
295 |
129 |
25 |
75 |
10 |
19 |
31 |
59 |
| Perth |
100 |
95 |
95 |
95 |
82 |
305 |
125 |
33 |
50 |
8 |
16 |
30 |
60 |
| Wolverhampton |
100 |
98 |
98 |
98 |
94 |
302 |
82 |
33 |
67 |
6 |
29 |
30 |
61 |
| Ripon |
100 |
95 |
95 |
95 |
82 |
305 |
125 |
33 |
50 |
7 |
16 |
29 |
62 |
| Lancaster |
99 |
92 |
90 |
90 |
88 |
297 |
125 |
20 |
80 |
7 |
15 |
29 |
63 |
| Worcester |
100 |
93 |
92 |
92 |
92 |
288 |
113 |
33 |
67 |
9 |
12 |
29 |
64 |
| Derby |
100 |
98 |
98 |
97 |
86 |
305 |
68 |
50 |
75 |
8 |
25 |
28 |
65 |
| Ely |
99 |
93 |
93 |
93 |
81 |
307 |
71 |
33 |
67 |
7 |
11 |
28 |
66 |
| Leeds |
99 |
96 |
96 |
96 |
92 |
301 |
83 |
20 |
80 |
6 |
18 |
27 |
67 |
| Aberdeen |
98 |
92 |
92 |
91 |
91 |
286 |
190 |
20 |
80 |
9 |
10 |
27 |
68 |
| Lisburn |
100 |
98 |
98 |
98 |
97 |
285 |
123 |
20 |
80 |
6 |
21 |
26 |
69 |
| Southend-on-Sea |
100 |
99 |
98 |
98 |
97 |
294 |
145 |
33 |
75 |
10 |
17 |
26 |
70 |
| Stoke on Trent |
99 |
97 |
97 |
96 |
84 |
303 |
136 |
20 |
80 |
9 |
10 |
26 |
71 |
| Milton Keynes |
100 |
96 |
96 |
95 |
95 |
287 |
186 |
20 |
80 |
7 |
20 |
26 |
72 |
| Dundee |
100 |
97 |
96 |
96 |
84 |
304 |
80 |
33 |
75 |
7 |
12 |
24 |
73 |
| St Albans |
99 |
95 |
95 |
94 |
80 |
309 |
40 |
20 |
80 |
5 |
8 |
23 |
74 |
| Portsmouth |
99 |
98 |
97 |
97 |
77 |
300 |
119 |
50 |
67 |
5 |
16 |
23 |
75 |
The UK’s best-connected cities
Portsmouth takes the top spot thanks to heavy investment from CityFibre, Vodafone, TalkTalk, and the government’s Project Gigabit scheme. Near-universal full-fibre access and minimal outages make it one of the most reliable digital hubs in the country.
Dundee is close behind, boosted by Scotland’s R100 programme and extra BDUK funding – helping operators like Openreach and Virgin Media O2 extend ultrafast fibre across the city.
In St Albans, demand from hybrid commuters has driven Openreach’s rapid full-fibre rollout, while strong 5G coverage from multiple mobile networks keeps residents connected on the move.
Stoke-on-Trent benefited from its city council’s ‘Silicon Stoke’ initiative, which accelerated broadband upgrades throughout the city. And, again thanks to a proactive council, Milton Keynes took an early adoption of ‘Gigabit City’ status and secured strategic investment by multiple network operators.
| CITY |
FULL FIBRE AVAILABILITY % |
Average Download Speed (Mbps) |
5G Coverage (% of homes / premises) |
Estimated % of Users with Frequent Signal Loss |
Estimated Outage Reports (per 1,000 users) |
Dead Zone Score |
Ranking 75 = Best |
| Portsmouth |
77 |
300 |
67 |
5 |
16 |
23 |
75 |
| St Albans |
80 |
309 |
80 |
5 |
8 |
23 |
74 |
| Dundee |
84 |
304 |
75 |
7 |
12 |
24 |
73 |
| Milton Keynes |
95 |
287 |
80 |
7 |
20 |
26 |
72 |
| Stoke on Trent |
84 |
303 |
80 |
9 |
10 |
26 |
71 |
| Southend-on-Sea |
97 |
294 |
75 |
10 |
17 |
26 |
70 |
| Lisburn |
97 |
285 |
80 |
6 |
21 |
26 |
69 |
| Aberdeen |
91 |
286 |
80 |
9 |
10 |
27 |
68 |
| Leeds |
92 |
301 |
80 |
6 |
18 |
27 |
67 |
| Ely |
81 |
307 |
67 |
7 |
11 |
28 |
66 |
The UK’s worst-connected cities
Sadly, not everywhere is enjoying such fast, flawless connectivity.
Bangor (Wales) ranks lowest. Much of the area still depends on older copper-based lines, and 5G coverage drops quickly outside the city centre.
Chichester and Stirling both face similar challenges: historic centres, older buildings and conservation zones that make fibre upgrades difficult.
Meanwhile, St Davids – the UK’s smallest city – struggles with geography. Its rugged Pembrokeshire coastline means mobile coverage is patchy and fibre builds are slow.
“Some areas are held back by geography, planning restrictions or lack of commercial incentive,” explains Geoff. “That’s why targeted investment programmes are so vital.”
| CITY |
FULL FIBRE AVAILABILITY % |
Average Download Speed (Mbps) |
5G Coverage (% of homes / premises) |
Estimated % of Users with Frequent Signal Loss |
Estimated Outage Reports (per 1,000 users) |
Dead Zone Score |
Ranking 1 = Worst |
| Bangor (Wales) |
57 |
287 |
75 |
10 |
40 |
73 |
1 |
| Chichester |
64 |
290 |
80 |
9 |
39 |
63 |
2 |
| Stirling |
68 |
283 |
80 |
9 |
45 |
62 |
3 |
| St Davids |
64 |
270 |
67 |
8 |
25 |
62 |
4 |
| Inverness |
62 |
316 |
80 |
12 |
12 |
61 |
5 |
| Winchester |
42 |
304 |
80 |
6 |
31 |
61 |
6 |
| Bangor (Northern Ireland) |
68 |
287 |
75 |
10 |
27 |
60 |
7 |
| Wrexham |
70 |
303 |
67 |
8 |
25 |
53 |
8 |
| Salisbury |
74 |
305 |
80 |
7 |
40 |
52 |
9 |
| Canterbury |
70 |
271 |
80 |
10 |
12 |
51 |
10 |
Why it matters
From home offices and online classes to Netflix nights and small business websites, almost everything we do depends on a solid internet connection. When it drops, we lose more than patience – it can mean missed calls, deadlines, or even income.
And the divide is growing. Cities with strong broadband attract new talent, remote workers and investment, while those left in the slow lane risk falling behind.
At Fibre Compare, we believe fast, reliable broadband shouldn’t depend on your postcode. Every household deserves a fair connection.
The tech behind the speeds
- Full fibre (FTTP) – fibre runs all the way to your home for consistently high speeds.
- Gigabit broadband – download speeds of 1,000 Mbit/s or more, this can be delivered by full fibre or HFC networks
- HFC cable – Virgin Media 02’s fibre-and-coax mix offering ultrafast performance (despite the high speeds, it can’t be officially classed as ‘full fibre’).
- FTTC (VDSL) – fibre to your street cabinet, copper the rest of the way, typically can only go up to 80 Mbps max.
Check your area
Curious how your city ranks? Explore the full Digital Dead Zone Index and see whether your postcode is powering ahead, or still waiting to catch up.
“Broadband used to be a luxury,” adds Geoff. “Now it’s a lifeline – for work, learning, and staying connected to the people who matter most.”
Methodology:
The Digital Dead Zone Index ranks UK towns and cities on how well they stay connected, by combining Ofcom and government data on broadband, mobile coverage and reliability into a single score. The analysis by Fibre Compare looks at the availability of superfast, ultrafast, full fibre and gigabit broadband, average download and upload speeds, mobile 4G and 5G coverage, and reliability factors such as outage reports and signal loss.
Each factor is weighted by importance, with broadband quality and availability making up (50%) included in the 50% is superfast (10%), ultrafast (10%), full fibre (10%), gigabit (10%), download speed (5%) and upload speed (5%), followed by mobile coverage (20%) made up of 4G (10%) 5G (10%) and reliability (30%) which is signal loss (10%) Outages (20%).
- Index Score = (Superfast_N x 0.10) + (Ultrafast_N x 0.10) + (FullFibre_N x 0.10) + (Download_N x 0.05) + (Upload_N x 0.05) + (Gigabit_N x 0.10) + (4G}_N x 0.10) + (5G_N x 0.10) + (SignalLoss_N x 0.10) + (Outages_N x 0.20).
- Normalised values to a 0-100 scale using min-max.
- Value = (X-Xmin) / (Xmax-Xmin) x 100.
- Weighting = Normalised value x metric weight.
For example to get the Superfast score you would multiply the normalised score by 0.10 because that counts for 10% of the overall score.
Data Sources:
- Ofcom fixed coverage and full fibre ('Ofcom Connected Nations Update: Spring 2025')
- Ofcom fixed coverage postcodes ('Ofcom Connected Nations Update: Spring 2025')
- Ofcom mobile coverage ('Ofcom Connected Nations Update: Spring 2025')
- Downdetector
- Openreach
- Gov.uk
- CityFibre
Make sure you’re on the best broadband deal today – use our postcode checker to see what’s available and start comparing now.


